Have Some Fun With CandleSticks
Hello Traders,
Today we are going to learn a very interesting topic named CandleSticks. Nobody does ever often listen about Candlesticks in day-to-day life. But it is really the most important factor to be known by a fresh trader. As we mentioned above we need to know about Candlesticks then let's give a brief look at them.
- CandleSticks Fundamentals
We can see many wide but important factors in Candle Sticks such as Higher High, Higher Low, Lower Low & Higher Low.
As we confront the real traders, they will teach you about understanding charts by using higher high and lower low patterns. Below are some images to get familiar with all these highs and lows.
- Candle Stick For A Time Being
Some candlesticks have a specific period. Such as if you want to see a candlestick of 10 minutes formation then you will see a graph with candlesticks showing 10 minutes' market fluctuation. If you want to see how much the market is changed during the past time in hours then set the candles according to 1 hour.
- What does a Candle Show Us?
Whenever we see a candle for a specific time we can tell much more about the market at that specific time. A candle can show you the highest rate hit by that particular stock/index in that specific time and the lowest too. It will show you that in that specific time interval of which candlestick is formed, where did the stock open and where did it get closed.
When a trader reads a graph and predicts it, then there is a 90% chance that he is using higher highs and lower lows for predicting it. And the remaining 10% goes to the traders who follow their own method to read the graph.
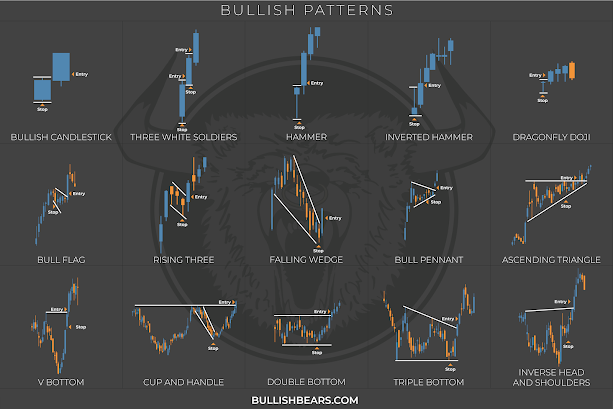
Well, some candlesticks form a combination of themselves which help traders about predicting the graph. Some of them are shown below.
You should learn paper trading first to find whether you are doing best or worst in graph reading. But at all, you must not 'let it go' to learn trading if you were determined to learn it. Just be patient and practice as much as you can.
Thank You


